
Streamline Network Observability on AKS: A Step-by-Step Guide to enable the AKS add-on with Terraform
Have you ever had to troubleshoot network issues in your Kubernetes clusters? If so, you know how challenging it can be to identify and resolve problems.
To troubleshoot network issues you probably had to use a combination of tools like kubectl, tcpdump, wireshark, and netstat. The list goes on and on… While these tools are great for debugging and capturing network logs and traces, they don’t provide a holistic view of your cluster’s network traffic.
The good news is that there’s a better way!
A few weeks ago, the Network Observability add-on for AKS was announced. This add-on is currently in preview and provides a simple way to enable network observability for your AKS clusters. The add-on is an eBPF-based solution that scrapes metrics from Kubernetes workloads and exposes them in Prometheus format. This allows you to use tools like Grafana to visualize your cluster’s network traffic. This can be either Bring-Your-Own Prometheus and Grafana or Azure-managed Prometheus and Grafana.
The AKS docs include a step-by-step guide for enabling the add-on using the Azure CLI.
In this blog post, I’ll walk you through the steps on how you can enable the AKS add-on using Terraform.
Before you begin
You should have an Azure subscription and the Azure CLI installed. You’ll also need to install the Terraform CLI.
If you have all of the above, you’re ready to get started!
Run the following command to log in to your Azure account using the Azure CLI:
az login
With the network observability add-on being in preview, you’ll need to register the NetworkObservabilityPreview feature by running the following command:
az feature register \
  --namespace "Microsoft.ContainerService" \
  --name "NetworkObservabilityPreview"
NOTE: This command can take a few minutes to complete. You can check the status of the feature registration using the following command:
az feature show \
  --namespace "Microsoft.ContainerService" \
  --name "NetworkObservabilityPreview"
You can proceed when feature has been registered.
Overview of what we’ll be doing
If you’ve used the Azure CLI command to enable the network observability add-on in your AKS cluster, you’ll find that all it takes is a single flag (–enable-network-observability) to enable the feature and a few commands to wire up the AKS cluster to the Azure managed Prometheus and Grafana instances. I want to use Terraform to provision the add-on. It’s a bit more involved but worth knowing how it’s all wired up.
The process of enabling the network observability add-on using Terraform can be broken down into the following steps:
- Create an AKS cluster
- Create an Azure Monitor workspace with data collection rules, endpoints, and alerts for Prometheus
- Enable the network monitoring add-on for the AKS cluster
- Create an Azure Managed Grafana instance with proper role-based access control (RBAC) assignments so that you can log into Grafana and for Grafana to access the Azure Monitor workspace
- Import the Kubernetes / Networking dashboard into our Grafana instance
After following the steps above, we’ll deploy a sample application to the AKS cluster and explore the network observability dashboard.
NOTE: If you’re really curious to know what the
--enable-network-observabilityflag does in Azure CLI, you can read through the source code here
Setting up Terraform providers
All my Terraform code can be found here. You can use this as a reference to follow along with the steps below.
Create a new Terraform configuration file named main.tf and add the following code:
terraform {
  required_providers {
    azurerm = {
      source  = "hashicorp/azurerm"
      version = "=3.62.1"
    }

    local = {
      source  = "hashicorp/local"
      version = "=2.4.0"
    }

    helm = {
      source  = "hashicorp/helm"
      version = "=2.10.1"
    }

    azapi = {
      source  = "Azure/azapi"
      version = "=1.7.0"
    }
  }
}

provider "azurerm" {
  features {
    resource_group {
      prevent_deletion_if_contains_resources = false
    }
  }
}

provider "helm" {
  kubernetes {
    config_path = local_file.example.filename
  }
}

locals {
  name     = "neto11y${random_integer.example.result}"
  location = "eastus"
}

data "azurerm_client_config" "current" {}
Here we are defining the required Terraform providers and the Azure provider configuration. We are also defining a few local variables that will be used throughout the Terraform configuration.
Notice that we’re using the azapi and helm providers in addition to the azurerm provider. The azapi provider is used to update our AKS cluster and enable the network observability add-on. With this AKS add-on being in preview, it is not yet available in azurerm, so this is a great opportunity to utilize the azapi provider to update the AKS resource.
The helm provider is used to deploy a sample application to our AKS cluster. We’ll get to that later.
Deploy AKS and Azure Monitor workspace for Prometheus
Append the following code to your main.tf file:
resource "random_integer" "example" {
  min = 100
  max = 999
}

resource "azurerm_resource_group" "example" {
  name     = "rg-${local.name}"
  location = local.location
}

resource "azurerm_kubernetes_cluster" "example" {
  name                = "aks-${local.name}"
  location            = azurerm_resource_group.example.location
  resource_group_name = azurerm_resource_group.example.name
  dns_prefix          = "aks-${local.name}"

  default_node_pool {
    name       = "default"
    node_count = 3
    vm_size    = "Standard_DS3_v2"
    os_sku     = "AzureLinux"
  }

  identity {
    type = "SystemAssigned"
  }

  monitor_metrics {
  }
}

resource "azurerm_monitor_workspace" "example" {
  name                = "amon-${local.name}"
  resource_group_name = azurerm_resource_group.example.name
  location            = azurerm_resource_group.example.location
}

resource "azurerm_monitor_data_collection_endpoint" "example" {
  name                = "msprom--${azurerm_resource_group.example.location}-${azurerm_kubernetes_cluster.example.name}"
  resource_group_name = azurerm_resource_group.example.name
  location            = azurerm_resource_group.example.location
  kind                = "Linux"
}

resource "azurerm_monitor_data_collection_rule" "example" {
  name                        = "msprom--${azurerm_resource_group.example.location}-${azurerm_kubernetes_cluster.example.name}"
  resource_group_name         = azurerm_resource_group.example.name
  location                    = azurerm_resource_group.example.location
  data_collection_endpoint_id = azurerm_monitor_data_collection_endpoint.example.id

  data_sources {
    prometheus_forwarder {
      name    = "PrometheusDataSource"
      streams = ["Microsoft-PrometheusMetrics"]
    }
  }

  destinations {
    monitor_account {
      monitor_account_id = azurerm_monitor_workspace.example.id
      name               = azurerm_monitor_workspace.example.name
    }
  }

  data_flow {
    streams      = ["Microsoft-PrometheusMetrics"]
    destinations = [azurerm_monitor_workspace.example.name]
  }
}

# associate to a Data Collection Rule
resource "azurerm_monitor_data_collection_rule_association" "example_dcr_to_aks" {
  name                    = "dcr-${azurerm_kubernetes_cluster.example.name}"
  target_resource_id      = azurerm_kubernetes_cluster.example.id
  data_collection_rule_id = azurerm_monitor_data_collection_rule.example.id
}

# associate to a Data Collection Endpoint
resource "azurerm_monitor_data_collection_rule_association" "example_dce_to_aks" {
  target_resource_id          = azurerm_kubernetes_cluster.example.id
  data_collection_endpoint_id = azurerm_monitor_data_collection_endpoint.example.id
}
This will deploy an AKS cluster and an Azure Monitor workspace. It will also create a data collection endpoint and a data collection rule that will collect Prometheus metrics from the AKS cluster and send them to the Azure Monitor workspace.
The random_integer resource is used to generate a random number that will be appended to the resource names to make them unique and get us around the Azure naming restrictions.
There are additional alerts you can configure for Prometheus, but that isn’t necessary for this walkthrough. We’ll omit those for now to keep this post relatively short. You can view the code for that here for node metrics and here for k8s metrics
Enable Network Observability add-on
Append the following code to your main.tf file:
resource "azapi_update_resource" "example" {
  type        = "Microsoft.ContainerService/managedClusters@2023-05-02-preview"
  resource_id = azurerm_kubernetes_cluster.example.id

  body = jsonencode({
    properties = {
      networkProfile = {
        monitoring = {
          enabled = true
        }
      }
    }
  })

  depends_on = [
    azurerm_monitor_data_collection_rule_association.example_dce_to_aks,
    azurerm_monitor_data_collection_rule_association.example_dcr_to_aks,
  ]
}
Here’s where we use the azapi_update_resource resource to enable the Network Observability add-on. You can see that we’re issuing a partial update to our AKS cluster resource. We’re only updating the networkProfile.monitoring.enabled property to true. This single flag enables the add-on.
Deploy Azure Managed Grafana and import dashboard
Append the following code to your main.tf file:
resource "azurerm_dashboard_grafana" "example" {
  name                = "amg-${local.name}"
  resource_group_name = azurerm_resource_group.example.name
  location            = azurerm_resource_group.example.location

  identity {
    type = "SystemAssigned"
  }

  azure_monitor_workspace_integrations {
    resource_id = azurerm_monitor_workspace.example.id
  }
}

resource "null_resource" "example" {
  provisioner "local-exec" {
    command = <<-EOT
      az grafana dashboard import \
        --name ${azurerm_dashboard_grafana.example.name} \
        --resource-group ${azurerm_resource_group.example.name} \
        --folder 'Managed Prometheus' \
        --definition 18814
    EOT
  }

  depends_on = [azurerm_role_assignment.example_amg_me]
}

resource "azurerm_role_assignment" "example_amon_me" {
  scope                = azurerm_monitor_workspace.example.id
  role_definition_name = "Monitoring Data Reader"
  principal_id         = data.azurerm_client_config.current.object_id
}

resource "azurerm_role_assignment" "example_amon_amg" {
  scope                = azurerm_monitor_workspace.example.id
  role_definition_name = "Monitoring Data Reader"
  principal_id         = azurerm_dashboard_grafana.example.identity[0].principal_id
}

resource "azurerm_role_assignment" "example_amg_me" {
  scope                = azurerm_dashboard_grafana.example.id
  role_definition_name = "Grafana Admin"
  principal_id         = data.azurerm_client_config.current.object_id
}
This will deploy an Azure Managed Grafana instance and import the AKS Network Observability dashboard into a folder called “Managed Prometheus”. It will also assign the necessary permissions to the Azure Managed Grafana instance and the Azure Monitor workspace. In the azurerm_dashboard_grafana resource definition, you can see that we’re using the azure_monitor_workspace_integrations block to integrate the Azure Managed Prometheus with Azure Managed Grafana.
Currently, there isn’t any way to automate the import of dashboards into Azure Managed Grafana using Terraform. This is why we’re using the null_resource resource to run the az grafana dashboard import Azure CLI command. This command will import the dashboard into Grafana. Here it is important that you have the proper permissions to import dashboards into Grafana. This is why we’re using the azurerm_role_assignment resource to assign the Grafana Admin role to the current user (you). This role also allows you to authenticate to the Grafana portal using your Azure AD credentials.
Deploy a sample application using Helm
Append the following code to your main.tf file:
resource "local_file" "example" {
  filename = "mykubeconfig"
  content  = azurerm_kubernetes_cluster.example.kube_config_raw
}

resource "helm_release" "example" {
  name       = "aks-store-demo"
  chart      = "../helm/aks-store-demo"

  depends_on = [
    azapi_update_resource.example
  ]
}
This deploys a sample application using the Helm provider. In order to authenticate to the AKS cluster, we’re using the local_file resource to write the kubeconfig file to a local file called mykubeconfig. We pass this kubeconfig file to the Helm provider when deploying the helm_release resource and will also use the file when executing kubectl commands below.
Get the endpoint for Azure Managed Grafana
Append the following code to your main.tf file:
output "amg_endpoint" {
  value = azurerm_dashboard_grafana.example.endpoint
}
This will output the endpoint for Azure Managed Grafana. You can use this endpoint to access the Grafana portal.
Run the Terraform deployment
Before we run the Terraform deployment, you may need to run a few Azure CLI commands to enable the necessary features.
If you haven’t deployed Azure Managed Grafana in your subscription yet, you may need to register the resource provider by running the following command:
az provider register \
  --namespace Microsoft.Dashboard
As mentioned above, we’ll be using Azure CLI to import a dashboard into our Grafana instance. If you haven’t used the Azure CLI to interact with Azure Managed Grafana before, you’ll need to enable the feature by running the following command:
az extension add --name amg
Now that we have all the code in place, we can run Terraform to deploy the resources. Run the following commands:
terraform init
terraform apply
This will initialize Terraform and deploy the resources. When prompted, type yes to confirm the deployment. The deployment will take a few minutes to complete.
Verify that the application is running
If you do not have kubectl installed, you can install it using by running the following command:
az aks install-cli
With the Azure resources and application deployed, you can now verify that it’s running by running the following kubectl command:
kubectl --kubeconfig mykubeconfig get pod
You should see output similar to the following:
NAME                                READY   STATUS      RESTARTS        AGE
makeline-service-7777968887-b5jgh   1/1     Running     0               9m20s
mongodb-588bb45ff4-68mrx            1/1     Running     0               9m20s
order-service-646cd9fbbb-nz2md      1/1     Running     0               9m20s
product-service-646dcdfc4d-k8dxw    1/1     Running     0               9m20s
rabbitmq-74699bc7f9-5q67r           1/1     Running     0               9m20s
store-admin-86d6c8c9c6-l6rt6        1/1     Running     0               9m20s
store-front-fb98898d5-j8285         1/1     Running     0               9m20s
virtual-customer-577f759489-kjpqs   1/1     Running     0               9m20s
virtual-worker-77dfb6d9c9-lw45q     1/1     Running     0               9m20s
Explore the Network Observability dashboard
Now that the application is running, you can explore the Network Observability dashboard. To do this, let’s get the endpoint for Azure Managed Grafana. Run the following command:
terraform output amg_endpoint
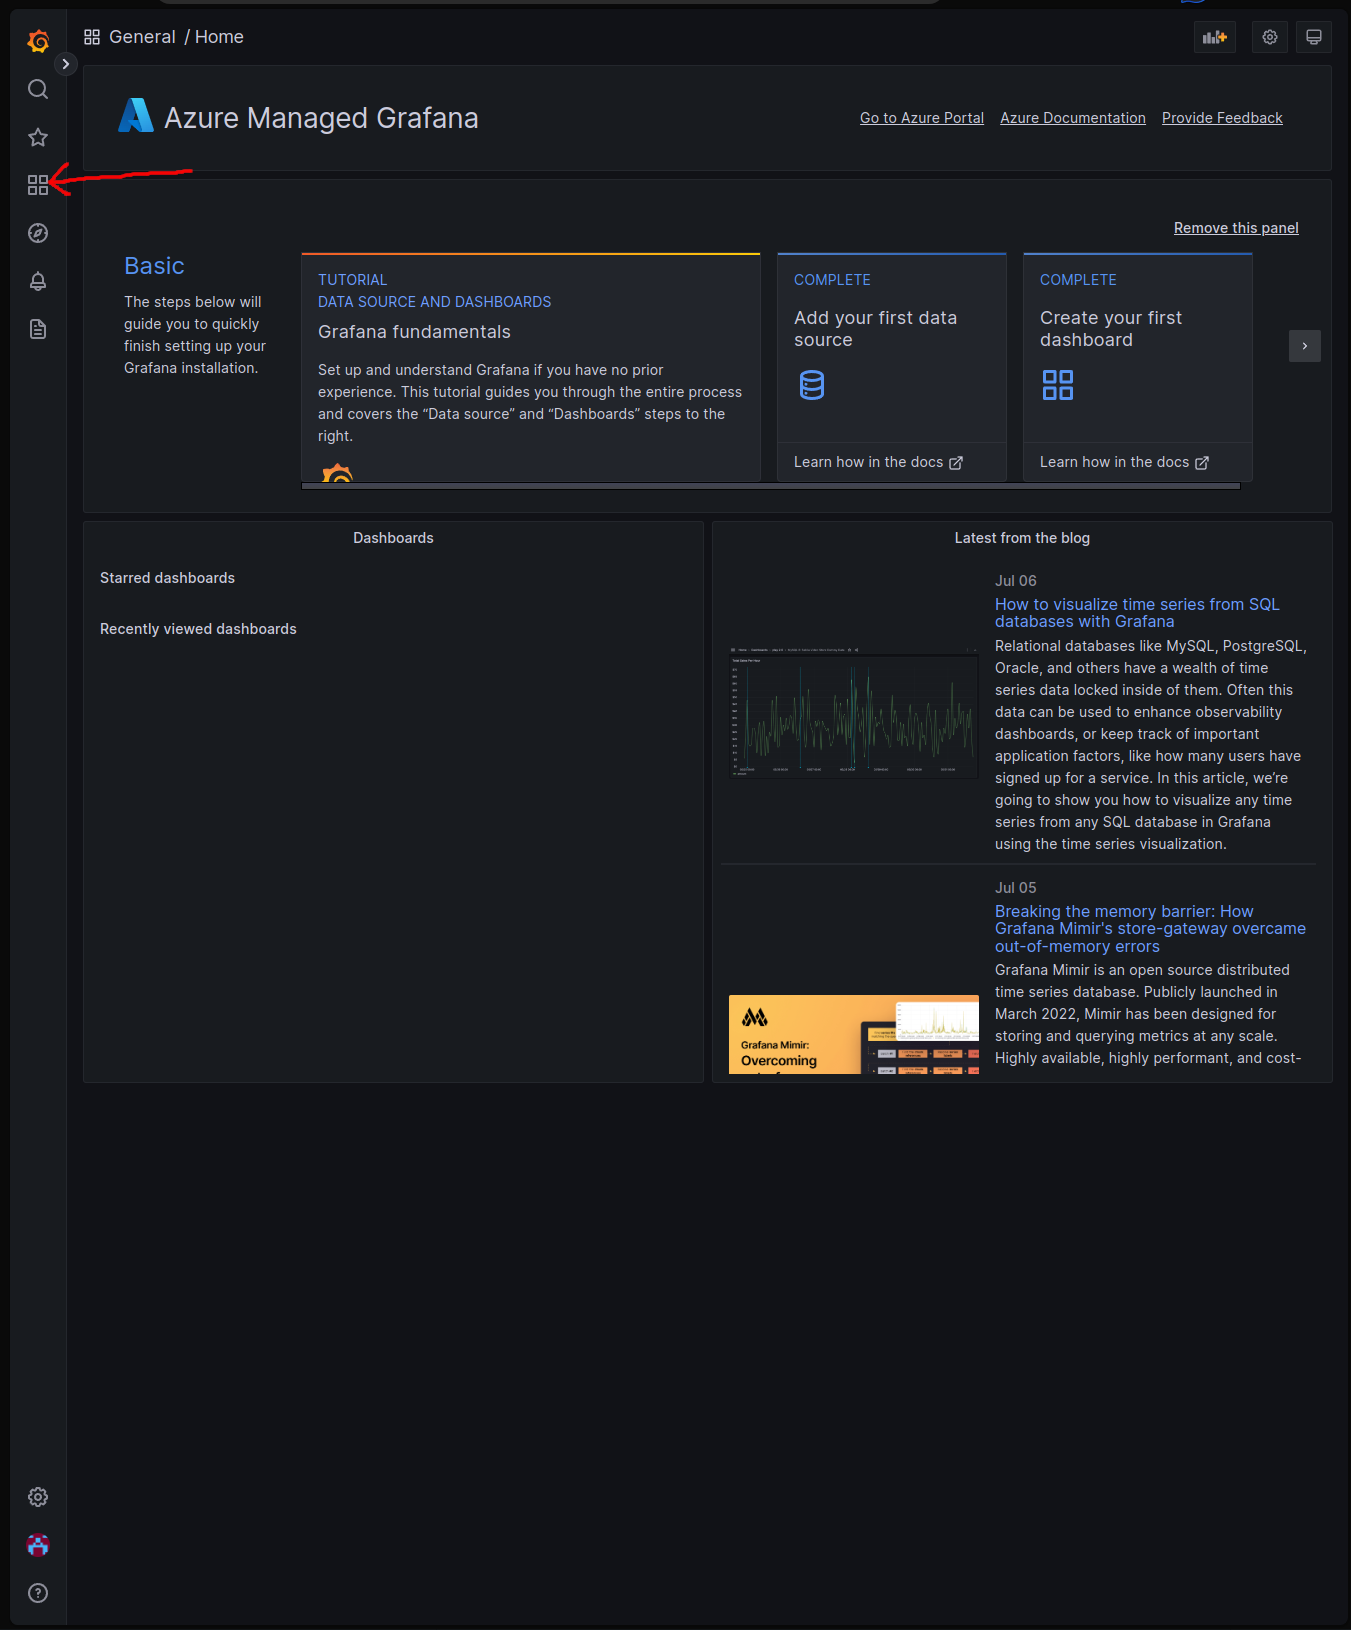
Open a browser and navigate to the Azure Managed Grafana endpoint. You should see a login page, where you can login using your Azure AD credentials. Once logged in, you’ll see navigation on the left side of the page. Click on the Dashboards button.
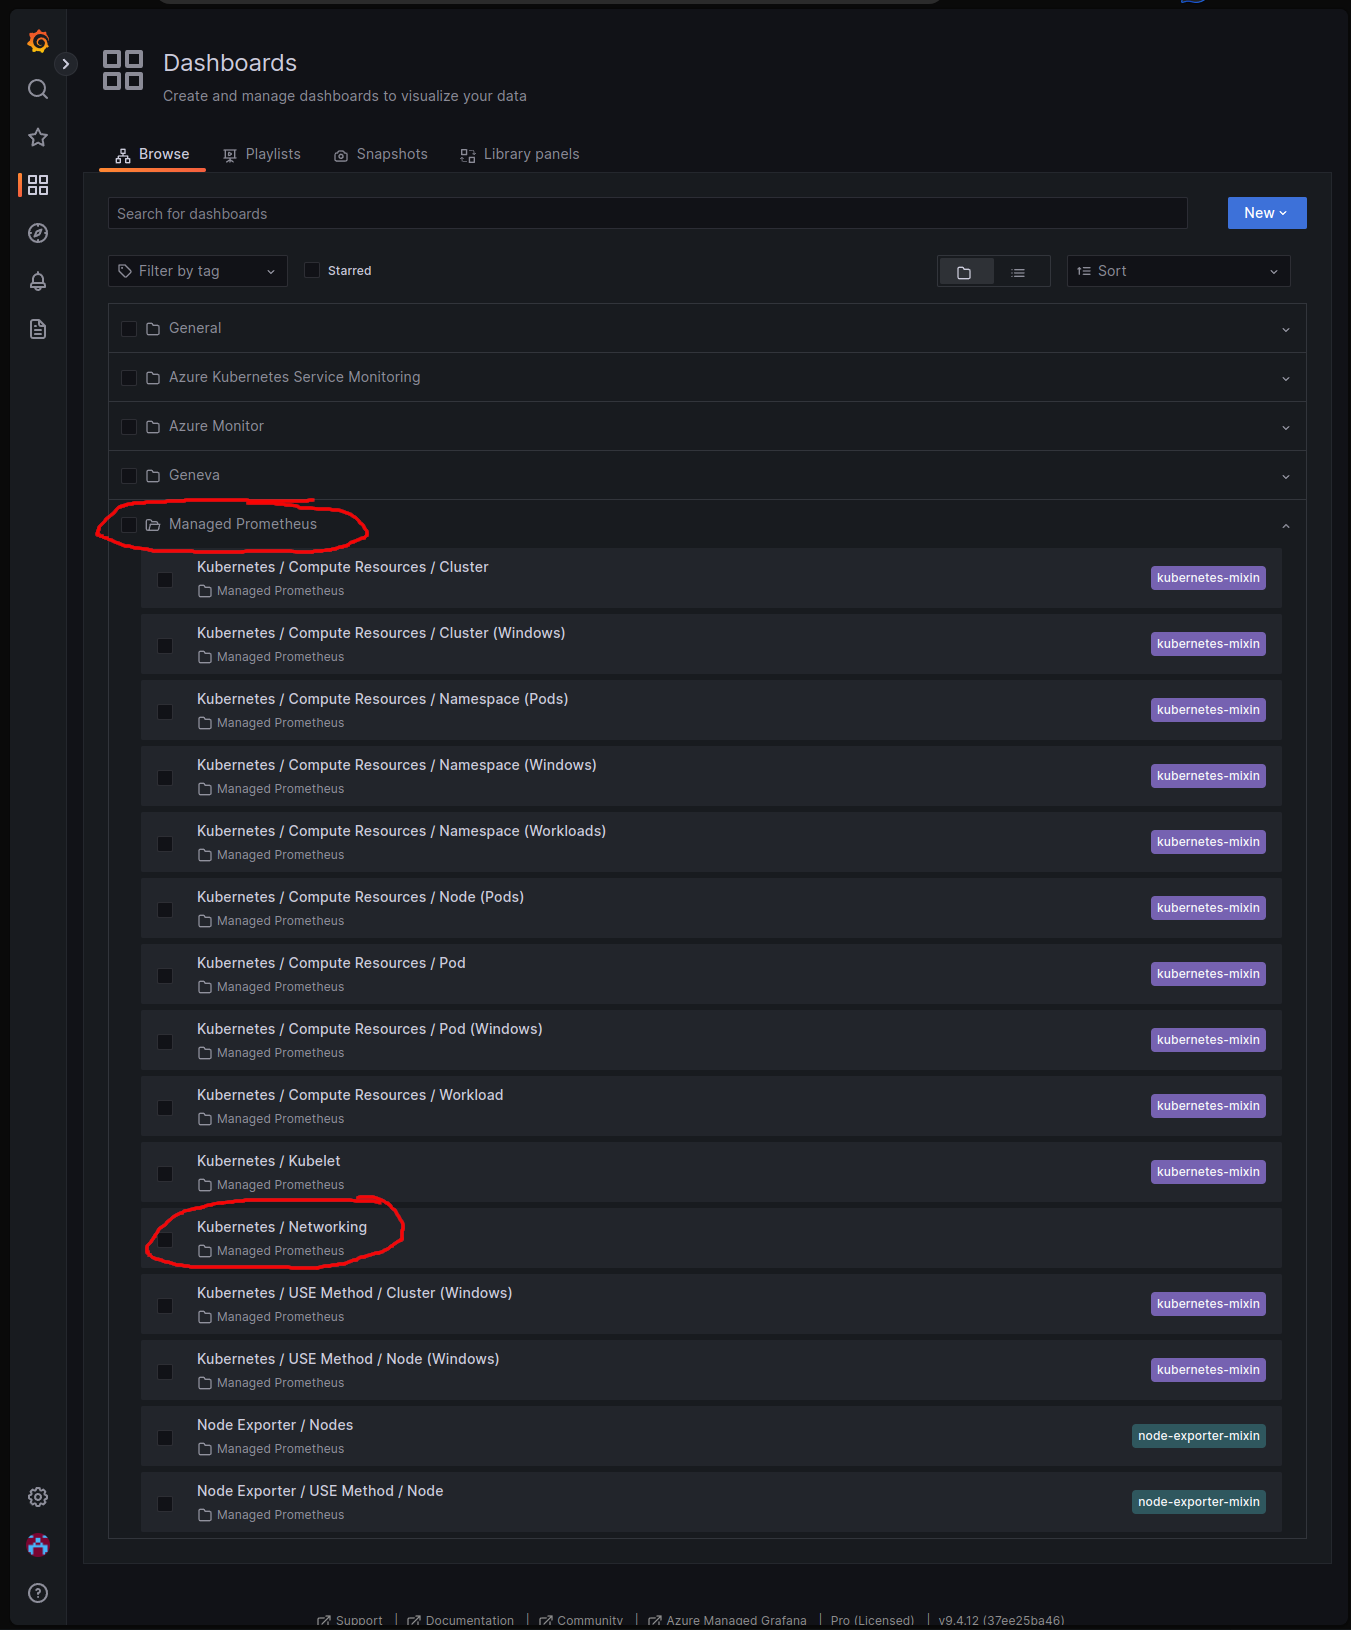
You should see a list of dashboards. Click on the Managed Prometheus folder to expand it. Here you should see the Kubernetes / Networking dashboard. Click on the dashboard to open it.
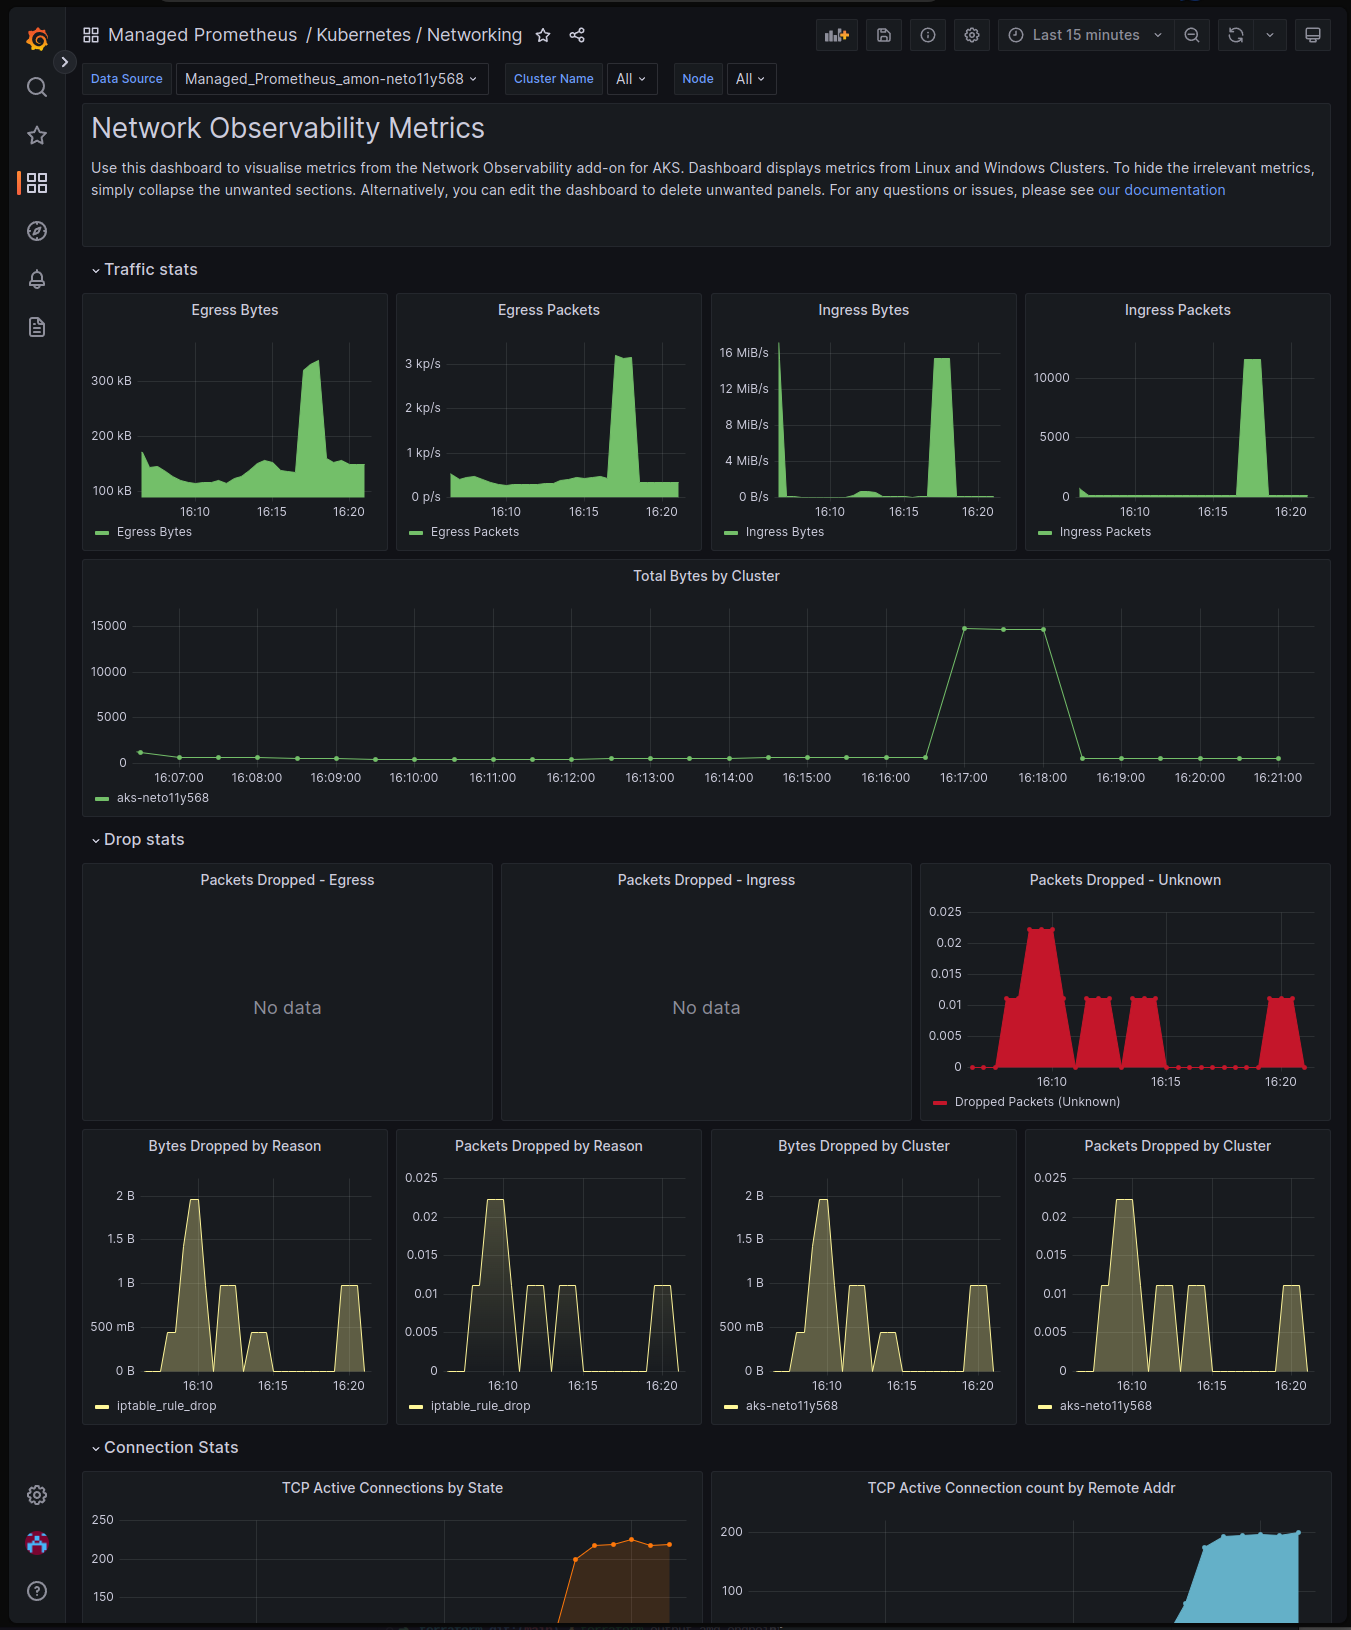
From here you can explore the dashboard and see the metrics that are being collected. You’ll notice there are several collapsible sections to view
- Traffic stats to view ingress and egress traffic packet rates
- Drop stats to view drop counters including IP table rule drops
- Connection stats to view TCP and UDP connection counters
- Interface stats to view and identify any issues with network interfaces
Conclusion
In this article, you learned how to streamline network observability in AKS using the Azure Kubernetes Service Network Observability add-on. You learned how to deploy the add-on using Terraform and how to explore the metrics in the Azure Managed Grafana dashboard. You also learned how to deploy a sample application using Helm and how to verify that it’s running, then explored the metrics in the Azure Managed Grafana dashboard.
Isn’t this a better way?!?

This feature is currently in preview and will continue to improve over time. It is limited to node-level metrics at this time, and pod-level metrics are coming soon.
If you have any feedback or suggestions, please feel free to reach out to me on Twitter or LinkedIn.
Peace ✌️
Resources
- Public Preview: Network Observability add-on on AKS
- What is Azure Kubernetes Service (AKS) Network Observability? (Preview)
- Setup of Network Observability for Azure Kubernetes Service (AKS) - Azure managed Prometheus and Grafana
- Azure Monitor managed service for Prometheus
- Monitor your Azure services in Grafana
- Kubernetes / Networking